Phase 8 & 9: Monitoring Stack & Container Insights
For more details, see: Deploy kube-prometheus-stack
Export Variables
export CERT_ARN=arn:aws:acm:us-east-1:730335615031:certificate/f0afb980-b86d-47cd-beaf-e8494affd00a
export ALB_GROUP_NAME=ecom-eks
export GRAFANA_HOST=grafana.ibtisam-iq.com
export PROMETHEUS_HOST=prometheus.ibtisam-iq.com
Prepare Helm Values
mkdir -p helm-values/monitoring

# Grafana values
cat > helm-values/monitoring/grafana-values.yaml << 'EOF'
grafana:
  ingress:
    enabled: true
    ingressClassName: alb
    annotations:
      alb.ingress.kubernetes.io/scheme: internet-facing
      alb.ingress.kubernetes.io/target-type: ip
      alb.ingress.kubernetes.io/backend-protocol: HTTP
      alb.ingress.kubernetes.io/listen-ports: '[{"HTTP":80},{"HTTPS":443}]'
      alb.ingress.kubernetes.io/ssl-redirect: "443"
      alb.ingress.kubernetes.io/certificate-arn: ${CERT_ARN}
      alb.ingress.kubernetes.io/group.name: ${ALB_GROUP_NAME}
      alb.ingress.kubernetes.io/healthcheck-path: /api/health
      alb.ingress.kubernetes.io/success-codes: "200"
    hosts:
      - ${GRAFANA_HOST}
EOF

# Prometheus values
cat > helm-values/monitoring/prometheus-values.yaml << 'EOF'
prometheus:
  ingress:
    enabled: true
    ingressClassName: alb
    annotations:
      alb.ingress.kubernetes.io/scheme: internet-facing
      alb.ingress.kubernetes.io/target-type: ip
      alb.ingress.kubernetes.io/backend-protocol: HTTP
      alb.ingress.kubernetes.io/listen-ports: '[{"HTTP":80},{"HTTPS":443}]'
      alb.ingress.kubernetes.io/ssl-redirect: "443"
      alb.ingress.kubernetes.io/certificate-arn: ${CERT_ARN}
      alb.ingress.kubernetes.io/group.name: ${ALB_GROUP_NAME}
      alb.ingress.kubernetes.io/healthcheck-path: /-/healthy
      alb.ingress.kubernetes.io/success-codes: "200"
    hosts:
      - ${PROMETHEUS_HOST}
    paths:
      - pathType: Prefix
  prometheusSpec:
    retention: 15d
    storageSpec:
      volumeClaimTemplate:
        spec:
          storageClassName: gp3
          accessModes: ["ReadWriteOnce"]
          resources:
            requests:
              storage: 20Gi
EOF

# Substitute env vars
envsubst < helm-values/monitoring/grafana-values.yaml    > helm-values/monitoring/grafana-values-rendered.yaml
envsubst < helm-values/monitoring/prometheus-values.yaml > helm-values/monitoring/prometheus-values-rendered.yaml
Install Stack
helm repo add prometheus-community https://prometheus-community.github.io/helm-charts
helm repo update prometheus-community

helm upgrade --install prometheus-stack prometheus-community/kube-prometheus-stack \
  --version 86.2.0 \
  --namespace monitoring \
  --create-namespace \
  -f helm-values/monitoring/grafana-values-rendered.yaml \
  -f helm-values/monitoring/prometheus-values-rendered.yaml
# STATUS: deployed
Verify
kubectl get po -n monitoring
# NAME                                                   READY   STATUS
# alertmanager-prometheus-stack-kube-prom-alertmanager-0  2/2    Running
# prometheus-prometheus-stack-kube-prom-prometheus-0      2/2    Running
# prometheus-stack-grafana-7d4cdb7cd8-97wvs               3/3    Running
# prometheus-stack-kube-prom-operator-...                 1/1    Running
# prometheus-stack-kube-state-metrics-...                 1/1    Running
# prometheus-stack-prometheus-node-exporter-* (×3)        1/1    Running

# Add CNAME records in DNS:
# grafana.ibtisam-iq.com    → <same ALB DNS as retail-microservices>
# prometheus.ibtisam-iq.com → <same ALB DNS as retail-microservices>
Shared ALB via Ingress Group
All three services (ui, grafana, prometheus) share a single ALB (k8s-ecomeks-ca3679ea54) through alb.ingress.kubernetes.io/group.name: ecom-eks. The ALB routes by Host header - no separate load balancer is provisioned per service.
Phase 9 - CloudWatch Container Insights (Fluent Bit)
Full reference: Deploy Fluent Bit for CloudWatch
Create Namespace
kubectl apply -f https://raw.githubusercontent.com/aws-samples/amazon-cloudwatch-container-insights/latest/k8s-deployment-manifest-templates/deployment-mode/daemonset/container-insights-monitoring/cloudwatch-namespace.yaml
# namespace/amazon-cloudwatch created
Create ConfigMap
[[ ${FluentBitReadFromHead} = 'On' ]] && FluentBitReadFromTail='Off' || FluentBitReadFromTail='On'
[[ -z ${FluentBitHttpPort} ]] && FluentBitHttpServer='Off' || FluentBitHttpServer='On'

kubectl create configmap fluent-bit-cluster-info \
  --from-literal=cluster.name="$CLUSTER_NAME" \
  --from-literal=http.server="${FluentBitHttpServer:-On}" \
  --from-literal=http.port="${FluentBitHttpPort:-2020}" \
  --from-literal=read.head="${FluentBitReadFromHead:-Off}" \
  --from-literal=read.tail="${FluentBitReadFromTail:-On}" \
  --from-literal=logs.region="$REGION" \
  -n amazon-cloudwatch
# configmap/fluent-bit-cluster-info created
Create IAM Policy & IRSA
cat > fluentbit-policy.json << EOF
{
  "Version": "2012-10-17",
  "Statement": [{
    "Effect": "Allow",
    "Action": [
      "logs:CreateLogGroup",
      "logs:CreateLogStream",
      "logs:PutLogEvents",
      "logs:DescribeLogStreams"
    ],
    "Resource": "*"
  }]
}
EOF

aws iam create-policy \
  --policy-name FluentBit-CloudWatch-Policy \
  --policy-document file://fluentbit-policy.json

eksctl create iamserviceaccount \
  --name fluent-bit \
  --namespace amazon-cloudwatch \
  --cluster $CLUSTER_NAME \
  --region $REGION \
  --attach-policy-arn arn:aws:iam::$ACCOUNT_ID:policy/FluentBit-CloudWatch-Policy \
  --approve
Attach Policy to Node Role
aws iam attach-role-policy \
  --role-name eks-nodes-stack-NodeInstanceRole-dUvoRmghNCrM \
  --policy-arn arn:aws:iam::$ACCOUNT_ID:policy/FluentBit-CloudWatch-Policy
Deploy Fluent Bit DaemonSet
kubectl apply -f https://raw.githubusercontent.com/aws-samples/amazon-cloudwatch-container-insights/latest/k8s-deployment-manifest-templates/deployment-mode/daemonset/container-insights-monitoring/fluent-bit/fluent-bit.yaml
Verify
kubectl get pods -n amazon-cloudwatch
# NAME             READY   STATUS    RESTARTS   AGE
# fluent-bit-54dvp  1/1    Running   0          102s
# fluent-bit-lcd4x  1/1    Running   0          102s
# fluent-bit-mhrgd  1/1    Running   0          102s

kubectl get ds -n amazon-cloudwatch
# DESIRED  CURRENT  READY  UP-TO-DATE  AVAILABLE
# 3        3        3      3           3
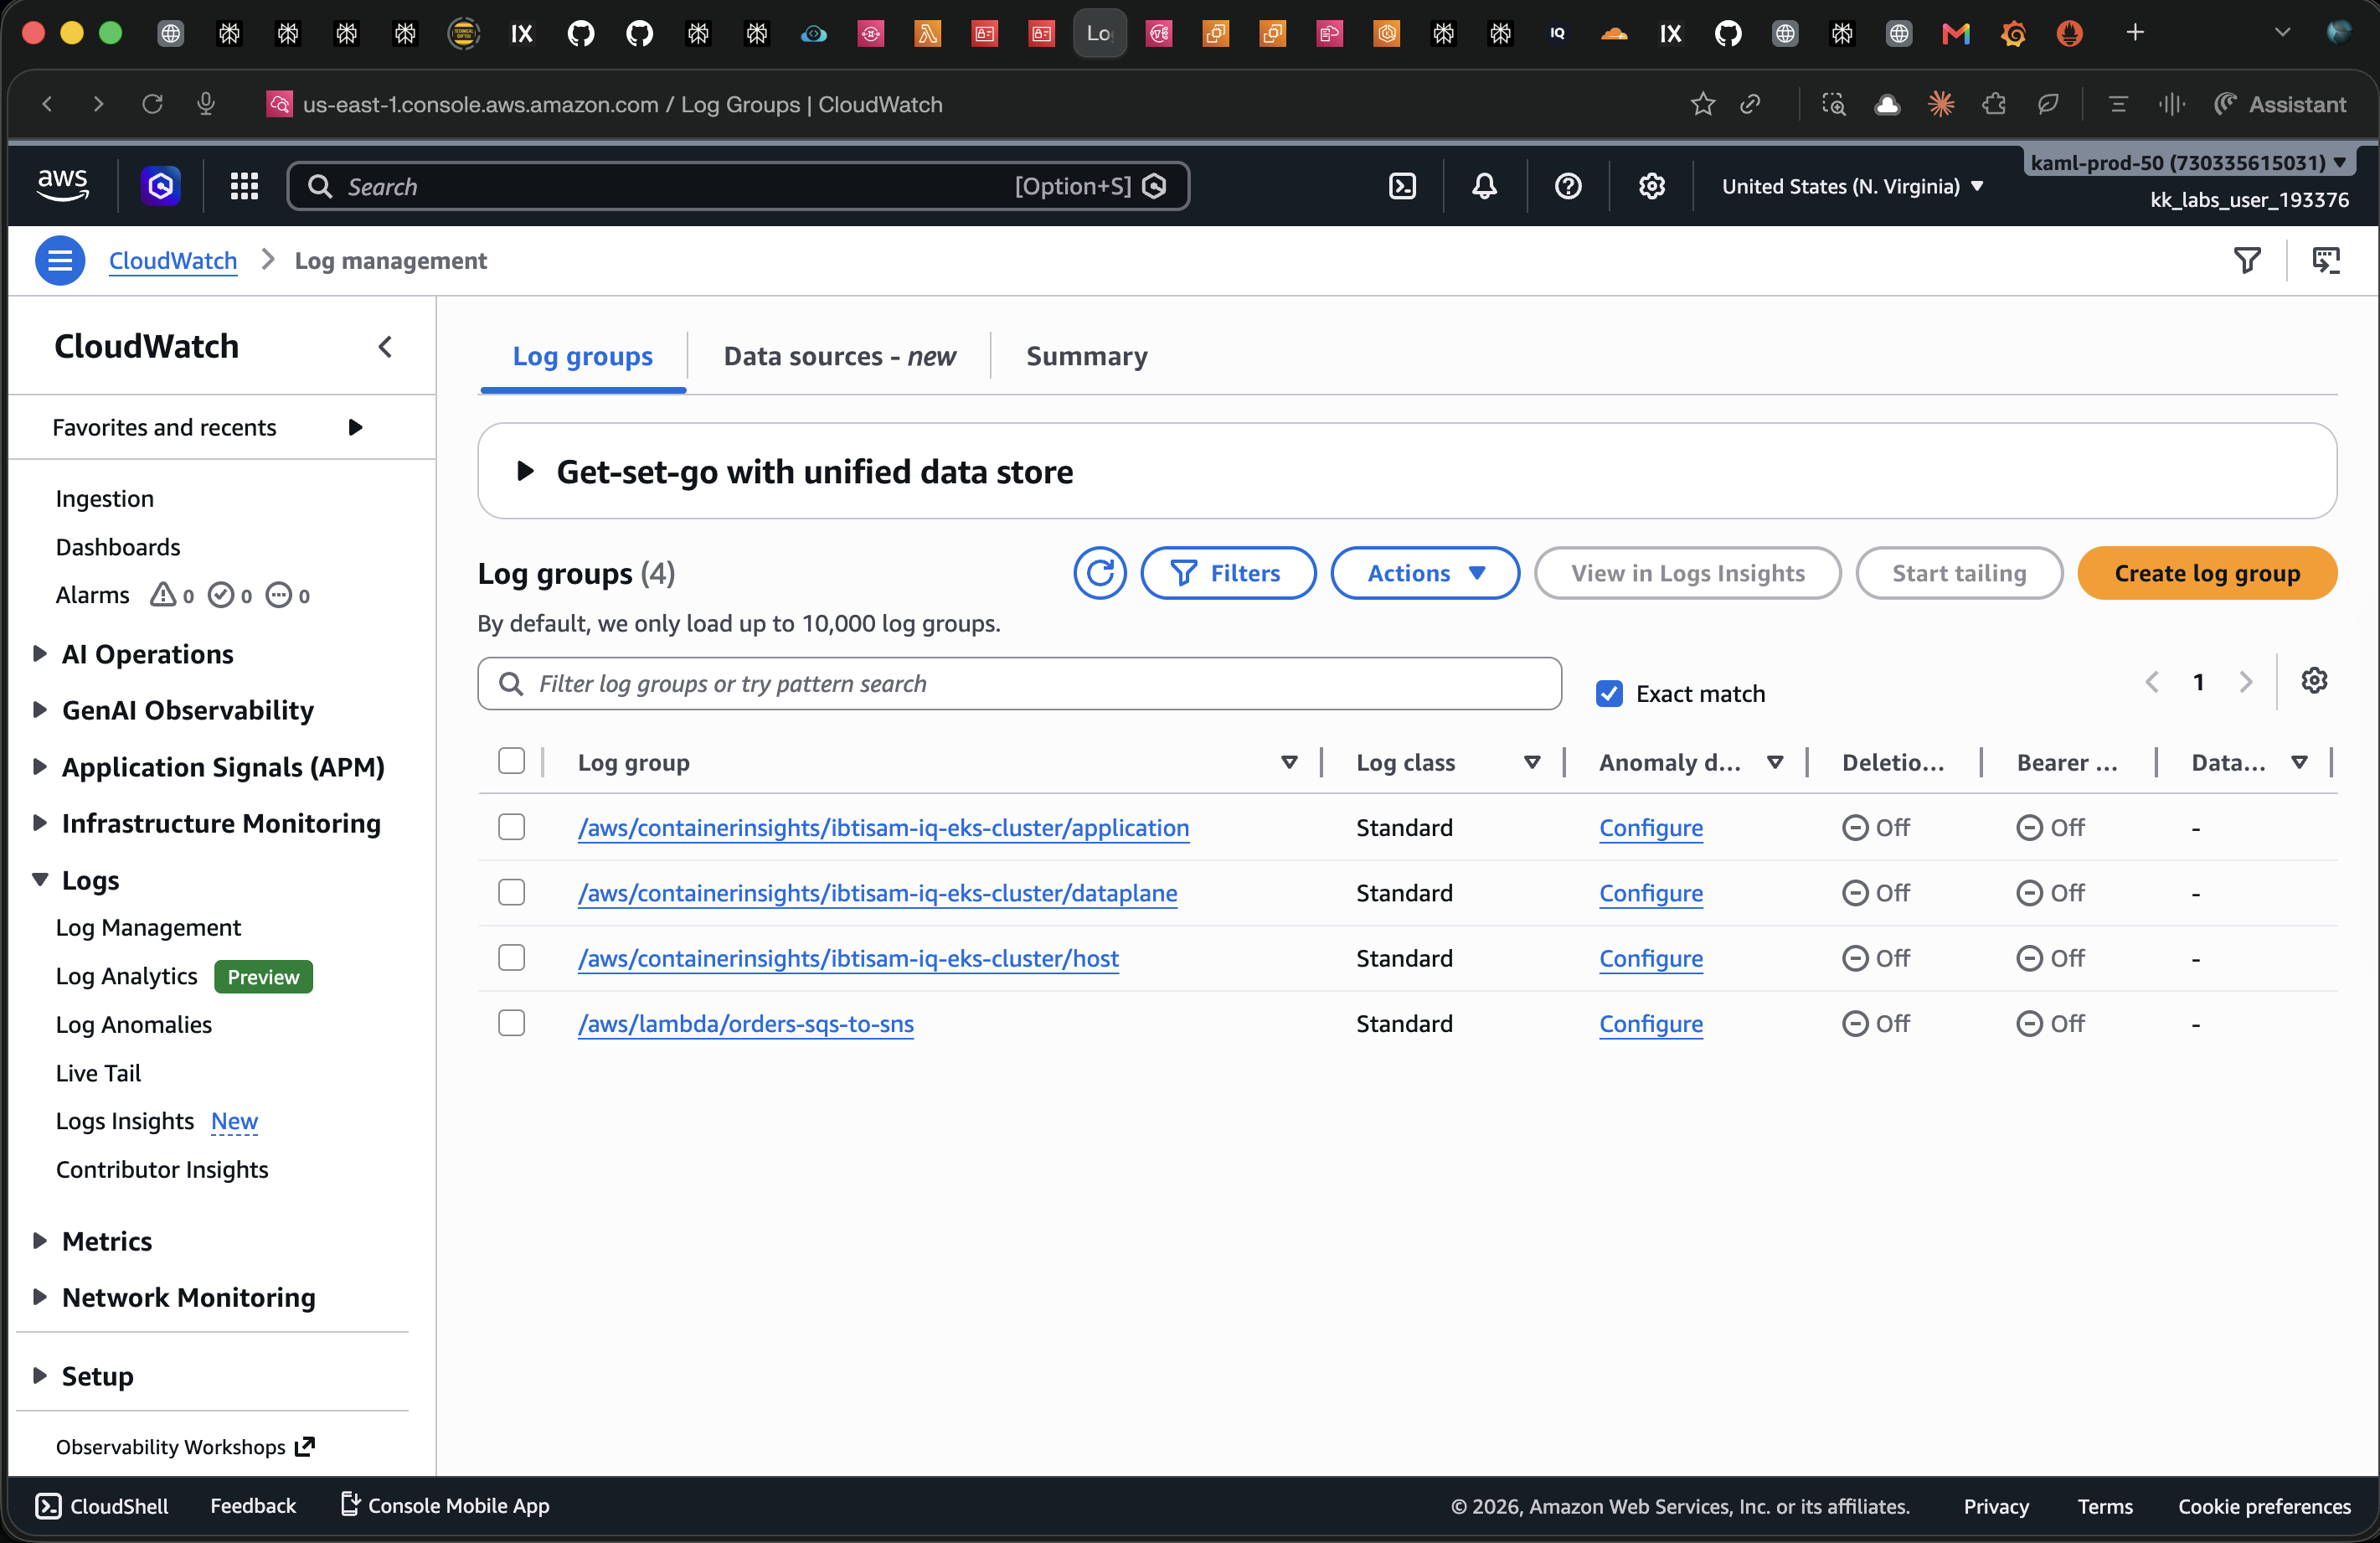
CloudWatch Log Groups created:
| Log Group | Contents |
|---|---|
/aws/containerinsights/ibtisam-iq-eks-cluster/application | Pod stdout/stderr logs |
/aws/containerinsights/ibtisam-iq-eks-cluster/dataplane | Kubernetes control-plane component logs |
/aws/containerinsights/ibtisam-iq-eks-cluster/host | Node-level OS and kernel logs |
/aws/lambda/orders-sqs-to-sns | Lambda invocation logs |